


Automated Business Intelligence: How to Move Beyond Dashboards
Date Published
Reading time
20 minIn this article
Traditional Dashboards Are Losing Their Luster
For years,
BI dashboards
have been the centerpiece of data-driven decision making. Yet evidence shows most dashboards end up underutilized. A Forrester study
found
that
only about 20% of potential enterprise decision-makers actually use BI tools hands-on; the other 80% rely on those who do
. In practice, many executives glance at a dashboard once and then revert to their
gut instinct, emails, or slide decks
for information. One product leader recounted building a “beautiful” executive dashboard that was barely touched – the exec who requested it
admitted
,
“I get what I need from my weekly meetings… That dashboard just shows me what already happened.”
This
reflects
a broader trend:
up to 70–75% of dashboards are rarely or never revisited
after initial viewing. In other words, traditional dashboards often become
“digital clutter”
, failing in adoption and impact.
Why do classic dashboards fall short? Static, retrospective reports only tell you
what has already happened
. By the time data is aggregated and visualized, the moment to act may be long gone. Analysts
note
that these legacy BI tools are typically
“not actionable and… not impactful,” delivered in silos without context.
A dashboard might show last quarter’s sales dip, but it won’t suggest
why
it happened or
what to do next
. At
Sphere
, we see that leaders need more than historical charts on a “single pane of glass”. They need timely intelligence that fits into their workflow and drives decisions forward – essentially, to
be data-powered, not just data-driven
.
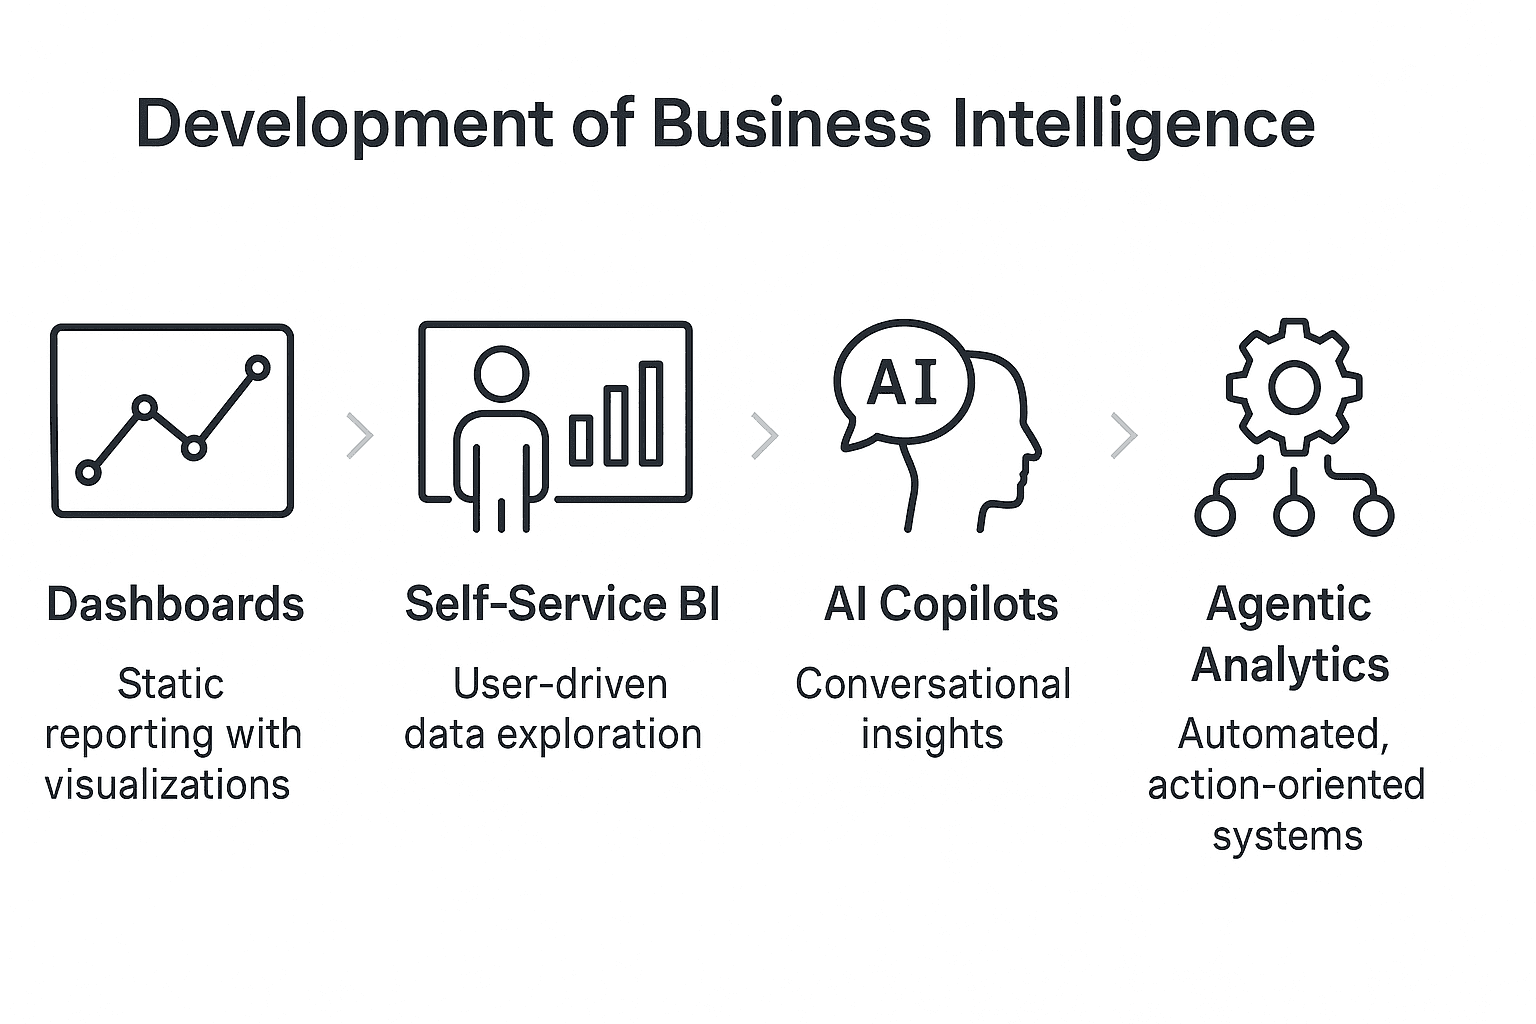
The Next Generation of BI: From Dashboards to Decisions
The good news is that a
paradigm shift
in analytics is underway. Instead of static dashboards that passively
“inform,”
organizations are embracing solutions that actively
“tell you what to do.”
Five emerging trends are reshaping how data is delivered and acted upon.
- Decision Feeds (Push > Pull)
Rather than expecting busy leaders to
pull
up a dashboard, the new approach
pushes
relevant insights directly to them. Think of it as a
“decision feed”
– important analytics updates delivered via the tools executives already use (e.g. Slack, Microsoft Teams, email) as they happen. For example, instead of hoping a VP checks a weekly churn report, a push system might proactively alert:
“
Churn risk spiked 12% in enterprise accounts this week. Suggested action: trigger a retention campaign now.”
This turns BI from a passive display into a
real-time alerting and recommendation engine
.
Research supports the effectiveness of push-style intelligence. Industry experts argue we must
“flip the paradigm, where analytics comes
to
you, rather than you having to go to analytics.”
In other words, embed analytics into daily workflows so insights arrive
in context and in time
to make a difference. It can be described as moving from
passive BI
to
Active Intelligence
, which is
“a
continuous flow
of intelligence and action, based on real-time, up-to-date information, designed to trigger action and engagement”
. In practice, that means critical metrics don’t languish on a portal – they generate Slack pings, mobile notifications, or emails that
reach decision-makers immediately
. By pushing tailored insights (and even prescriptive recommendations) to leaders, companies ensure that data isn’t just available, but
unignorable
. This high-signal, low-noise feed of intelligence helps executives focus on what truly needs attention, in the moment it matters.
- Conversational Analytics and AI Copilots
The next leap is letting people simply ask for the insight they need in natural language – and getting an instant, intelligent answer.
Conversational interfaces
are rising fast, thanks to advancements in AI and their integration into enterprise tools. Instead of clicking through filters or pivoting charts, a leader can now pose a question like,
“Why are rig downtimes up this month?”
and receive an explanation (in plain English) along with a generated visual – plus a recommended next step.
Major BI platforms have already begun rolling out AI copilots to enable this. Microsoft’s Power BI
Copilot
, Tableau’s new
Tableau GPT/Pulse
, ThoughtSpot’s
Sage
, and others all leverage large language models on company data. These tools allow executives to have a back-and-forth dialogue with their data. For instance,
Power BI Copilot
can build or modify a report through a chat prompt and then let the user drill deeper by asking follow-up questions. Tableau Pulse is designed as an AI-driven feed that
highlights key metrics and explanations
, even allowing users to query data via chat and get narrative answers or auto-generated charts. Importantly, these copilots don’t just spit out numbers – they can surface
context
(e.g. “Downtime is up mostly on Rig 14 due to increased pump failures”) and even suggest actions (perhaps “schedule preventive maintenance”).
At Sphere, we’ve taken this one step further with
SphereGPT
– a private enterprise AI assistant that brings conversational analytics and copilots directly into your business environment. Unlike generic copilots, SphereGPT is tailored to your data sources, compliance needs, and workflows. It not only answers questions and generates visuals but can also act as a secure AI coworker: drafting narratives, summarizing key insights, and triggering next-best actions across enterprise systems.
The rise of enterprise AI assistants means analytics are becoming as easy as a conversation. Executives no longer need to hunt through a maze of dashboards for answers; they can simply ask, and the system will find and explain the data. This greatly lowers the barrier to insight for non-technical leaders. Indeed, we are likely at the start of a new norm where
“all major analytics players introduce GPT-powered conversational features”
to their products. With solutions like SphereGPT, natural language BI turns analytics from a specialized interface into a casual dialogue – bringing data directly into decision-makers’ thought process with minimal friction.
- Automated Actions and AI Agents
The logical evolution after getting insights is to
act on them
– so why not have the system do that too? The frontier of advanced analytics is about
closing the loop from insight to action automatically
. Instead of just alerting a human that inventory is low or a risk is high, the system (following predefined rules or AI logic) can
execute decisions
on the company’s behalf.
Consider a traditional dashboard scenario: you see that a product’s stock fell below threshold; then someone has to go into the procurement system to reorder. In the new model, an
AI agent
could detect the low inventory trigger and
auto-generate a replenishment order
with approved vendors – no human needed for the routine step. Similarly, if a sales pipeline is drying up, an agent might automatically launch a nurture email campaign rather than simply flashing a red warning on a report.
This move towards
decision automation
is sometimes called
agentic analytics
. It uses autonomous or semi-autonomous software agents to continuously monitor data, make choices, and initiate workflows via APIs. Traditional BI ends at the chart – users are left to interpret and act on their own. Agentic analytics goes further by empowering AI agents not just to analyze but also to decide and execute actions directly within business processes. In other words, the BI system doesn’t just tell you
what
is happening; it
does something about it
.
We’re already seeing early examples: e.g. ServiceNow integrating Databricks to automatically trigger remediation tasks when certain risk analytics fire. These are stepping stones toward a future where routine decisions (following well-defined business rules or AI models) can be offloaded to “bots.”
AI agents
can handle thresholds, anomalies, and recurring decisions at scale and speed far beyond human capability – all while logging actions and outcomes for review. The payoff is not only efficiency but consistency and responsiveness. Instead of a lag between insight and response, companies achieve a
continuous flow from data to action
. As a result, teams are freed up to focus on strategy and complex cases, while the “machine” takes care of the operational decisions in real time.
- Narrative Intelligence (Automated Data Storytelling)
Another limitation of dashboards is that they
display numbers
but don’t always convey the
story or significance
behind those numbers. This is where
narrative intelligence
comes in – turning raw data into a written or spoken narrative that highlights what happened, why, and what it means for the business. In essence, it’s about moving from disjointed charts to an
automated executive briefing
in natural language.
For example, a dashboard might show a dozen metrics for an oil & gas operation. A narrative system would summarize:
“Rig 14’s downtime was
2× higher
this quarter due to increased pump failures; as a result, the maintenance budget is projected to overrun by
8%
next month unless supplier delays are resolved.”
This kind of generated analysis tells a
cohesive story
that busy teams can quickly absorb. It answers the
“So what?”
behind the data, not just the
“What?”
.
Technology in this space has advanced rapidly.
Data storytelling startups
(like Narrative Science, recently acquired by Tableau/Salesforce) and BI vendors’ built-in
natural language generation
tools can now produce tight, contextual narratives from dashboards. These narratives often highlight exceptions, causations, and trends that might be missed in a visual scan. Analysts note that narrative explanations can be far more accessible to business users than complex charts – they
“deliver easily understandable narratives rather than complex dashboards or data visualizations that business users might find hard to interpret.”
Even data-savvy professionals benefit: studies show people interpret information more effectively through a mix of story and visuals than by visuals alone.
Recognizing this, analysts
predict
that
data storytelling will be the most widespread way of consuming analytics
, and
a full 75% of all data narratives will be automatically generated by AI/ML tools
(rather than written manually by analysts). In short, within the next few years, your analytics platform might not present a static dashboard at all – instead, it could provide a personalized
briefing
each morning, written in plain language, explaining what’s going on in the business and pointing out issues that need attention. This
“narrative intelligence”
transforms dashboards from a DIY analytic tool into a delivered insight product, telling each stakeholder what they need to know in a story format. It’s a powerful way to cut through data overload and drive understanding and action.
- Directive-Focused Analytics (The “Directive Fabric” Frontier)
Looking further ahead, the very role of business intelligence may shift from monitoring
everything
to laser-focusing on achieving specific
business directives
. In this emerging
directive-driven
model, companies define their top objectives (e.g.
“Improve equipment uptime by 5% this quarter”
or
“Reduce cost per unit by 3%”
) and the analytics fabric self-organizes around those goals. Every report, alert, and AI agent is aligned to tracking progress on the directive and flagging any deviation. Essentially, instead of endless KPIs and slice-and-dice exploration, the system provides a continuous answer to:
“Are we on track or off track for our declared objectives, and what’s being done about it?”
In a directive-focused framework, traditional dashboards become far less relevant – you don’t roam through data looking for insights, because the
platform actively watches all relevant data
for you in context of the goal. If the directive is slipping (say uptime is trending below target due to a particular recurring fault), the fabric surfaces that insight
and triggers a response
(perhaps scheduling additional maintenance or reallocating resources automatically). This concept builds on components we’ve discussed – it requires push alerts, AI agents, and narratives – but ties them to
strategic intents
set by leadership. It’s akin to having a digital COO constantly monitoring the business’s OKRs (Objectives and Key Results) and
directing analytic resources
to where they matter most.
While few organizations have fully realized this vision yet (hence calling it a
“frontier trend”
), the pieces are falling into place. Gartner’s growing emphasis on
Decision Intelligence
– combining decision modeling, analytics, and AI to directly improve business decisions – aligns with this idea. By 2026,
75% of Global 500 companies will formalize decision intelligence practices
in some form, according to Gartner forecasts. We can expect those practices to include linking analytics outputs to business outcomes in a tight loop. In practical terms, directive-driven analytics means an executive could set a directive (
“increase customer satisfaction to 95%+”
) and the data systems would continuously assess every metric, from support ticket resolution times to product usage patterns, in service of that goal –
alerting and intervening wherever needed
. It’s a future where the question
“How are we doing on our key goals?”
is answered not via periodic reviews of static reports, but
through an intelligent fabric that is always monitoring and course-correcting
in real time. Dashboards, in such a world, might indeed feel obsolete.

What Companies Should Do Instead of Relying on Dashboards
If traditional dashboards are
retrospective, passive, and pull-based
, the new paradigm is
directive-driven, proactive, embedded, and automated
. Getting there is a journey. Here are five concrete shifts organizations (especially at the C-suite and data leadership level) should consider making
now
to modernize their BI stack:
1. Shift from a “Single Pane of Glass” to a Continuous Flow of Decisions:
Stop thinking of BI as a static portal or one-stop dashboard. Instead, build a
continuous decision flow
that feeds insights and alerts to the right people at the right time. In practice, this means implementing real-time data pipelines and alerting mechanisms. Rather than reviewing stale monthly reports, decision-makers should receive a steady drip of key findings as they emerge (e.g. anomaly detections, goal progress updates, threshold triggers). By moving from periodic pull-based reports to
continuous push-based intelligence
, you ensure critical information isn’t missed and decisions happen faster.
2. Embed Intelligence into Workflows and Tools:
Meet your users where they already work. Embed analytics and AI insights directly into daily tools – whether that’s Teams/Slack, CRM systems, ERP platforms, or custom applications. The idea is that an employee shouldn’t have to leave their workflow to hunt for data; the data (and context) should come to them
in situ
. As a Qlik executive put it,
“build analytics into our workflows and processes… put data insights into the hands of not just information workers, but also ‘workers with information’”
. This might involve using BI integrations (for example, Power BI within Teams, or Slack bots that answer data questions) and embedding charts or KPIs in operational dashboards. By integrating analytics at point-of-use, you dramatically increase adoption and action. Notably,
Sphere’s Data Analytics Services
emphasize this approach –
Sphere goes beyond static dashboards by implementing BI tools with streaming data and
AI-driven alerts, so decision-makers can act on events as they happen
. The result is analytics that
accelerate
work rather than interrupt it.
3. Adopt AI Copilots and Natural Language Interfaces:
Enable your leaders (and frontline staff) to interact with data as naturally as they would with a human analyst. This means piloting
AI copilots
or conversational BI tools that allow questions in plain language and provide meaningful answers with supporting visuals or narrative. Many modern BI platforms already offer this or will soon – consider trying out features like Power BI’s Copilot (in preview) or Tableau’s forthcoming GPT integrations. Also explore third-party AI analytics assistants. The goal is to eliminate the friction between the question in a decision-maker’s mind and the answer buried in the data. When an executive can simply
ask
, “What’s driving our increase in customer churn?” and get an immediate, explained response, it prevents the all-too-common scenario of ignoring data in favor of gut feel. It also democratizes data access beyond the analyst team. Gartner projects that by 2024,
one-third of large organizations will have adopted decision intelligence
(which often includes such natural language/queryable data tools) to improve decision-making. Don’t be left behind – start weaving AI-driven Q&A into your analytics strategy.
At Sphere, we’ve learned that most dashboards end up as static reports that executives glance at once and then ignore. So, instead of forcing leaders to go hunting for charts, we deliver real-time insights and AI-driven recommendations inside the tools they already use. The result: decisions happen faster, actions happen automatically, and companies move from being data-driven to truly data-powered.
Mario Schwarts,
Managing Director Data & AI Practice
4. Automate Repeatable Actions and Close the Loop:
Identify where your BI insights lead to
repetitive or rule-based decisions
, and automate those via triggers or agents. This might involve setting up simple if-then rules (e.g., with tools like Power Automate, IFTTT, or SaaS automation platforms) or deploying more sophisticated AI decision agents. Begin with low-hanging fruit: scenarios where the
response
to a metric change is well-defined. For instance, if a web KPI falls below a threshold, automatically create a Jira ticket for the web team; if weekly revenue lags forecast by X%, have the system email a detailed diagnostic to stakeholders with recommended actions; if an IoT sensor detects a fault, auto-schedule maintenance. By
closing the loop
in as many places as possible, you reduce decision latency and human workload. Start instilling an “automation first” mindset in your data team: every dashboard metric should spark the question,
“Can/should this trigger an action on its own?”
5. Align Analytics to Directives (Focus on Outcomes, not Just KPIs):
Finally, reorient your analytics strategy around the business’s
strategic objectives
rather than a sprawling set of vanity metrics. This means using frameworks like OKRs or strategic initiatives to drive what your data team monitors and delivers. Establish clear directives (e.g. improve customer NPS, expand margin, grow user engagement) and ensure that your reports, alerts, and models explicitly tie back to these goals. Track progress
continuously
, not just in quarterly reviews. By doing so, you create a culture – and technical architecture – where everyone knows what success looks like and data is the litmus test for it. It also helps combat the “data puke” problem of dashboards: instead of 100+ disjointed KPIs, you double down on the
vital few metrics that signal mission success
. Modern data platforms can help by providing goal-tracking dashboards or scorecards with alerting when off-track, but the key is a mindset shift:
analytics is not about the coolest visualization, it’s about moving the needle on business directives
. As an example, rather than countless sales charts, define “Increase quarterly sales by 10%” and have all analytics – from pipeline health scores to lead response times – feed into that narrative, with AI flagging risks or opportunities to achieve the objective. This directive-aligned approach ensures your fancy new BI tools
actually deliver business value
. As one expert succinctly said,
“Better dashboards lead to better decisions,”
but the
best
analytics framework directly drives the decisions that drive your business.
The 5 Pillars of Implementing a Successful AI Strategy in 2025
Transitioning into a data-driven organization is not a final destination, but a journey. Get the complete picture of building for the future, the challenges you may face and overcoming them to find business success
DownloadTransitioning into a data-driven organization is not a final destination, but a journey. Get the complete picture of building for the future, the challenges you may face and overcoming them to find business success
Conclusion:
Data-Powered
Decision Making for the Win
The era of the static, generic dashboard is waning. In its place, a more dynamic and intelligent approach to business intelligence is emerging – one where
insights find you
, in context, and often come with an action attached. Organizations that embrace these changes will transform from being merely
data-driven
(collecting lots of stats) to truly
data-powered
(using data as a real-time engine for decision and action). Research-backed trends like proactive decision feeds, conversational analytics, automated agents, narrative storytelling, and directive-focused monitoring are not science fiction; they are already being implemented by forward-thinking enterprises and supported by the latest tools.
For executives and tech leaders, the message is clear:
stop building dashboards for dashboards’ sake
. If 70-80% of your reports are going unread, it’s time to reimagine your BI strategy. Focus on delivering
intelligence
– not just information – that is timely, contextual, and actionable. Invest in the capabilities (and partners) that can embed this intelligence into daily operations. For instance, as we highlighted, Sphere’s approach to data services is geared exactly toward this new paradigm, melding real-time analytics with AI-driven actions so that insights don’t sit idle. The companies that succeed in the next decade will likely be those who effectively
augment their human decision-makers with AI and automation
, creating a seamless fabric of data-driven directives and responses.
In sum, the future of business analytics isn’t a prettier dashboard or a more elaborate chart – it’s a proactive
brain
for your business that tells you what’s happening, what’s coming, and what to do about it. The tools are here or coming fast. The cultural shift is underway. Now is the time to ride this wave and ensure your organization is not just driven by data, but
powered
by it – making smarter decisions at every turn, and doing so at the speed of modern business.
This shift from dashboards to decision intelligence is exactly what Sphere is helping organizations achieve: becoming truly data-powered, with insights that don’t just inform but direct and act.
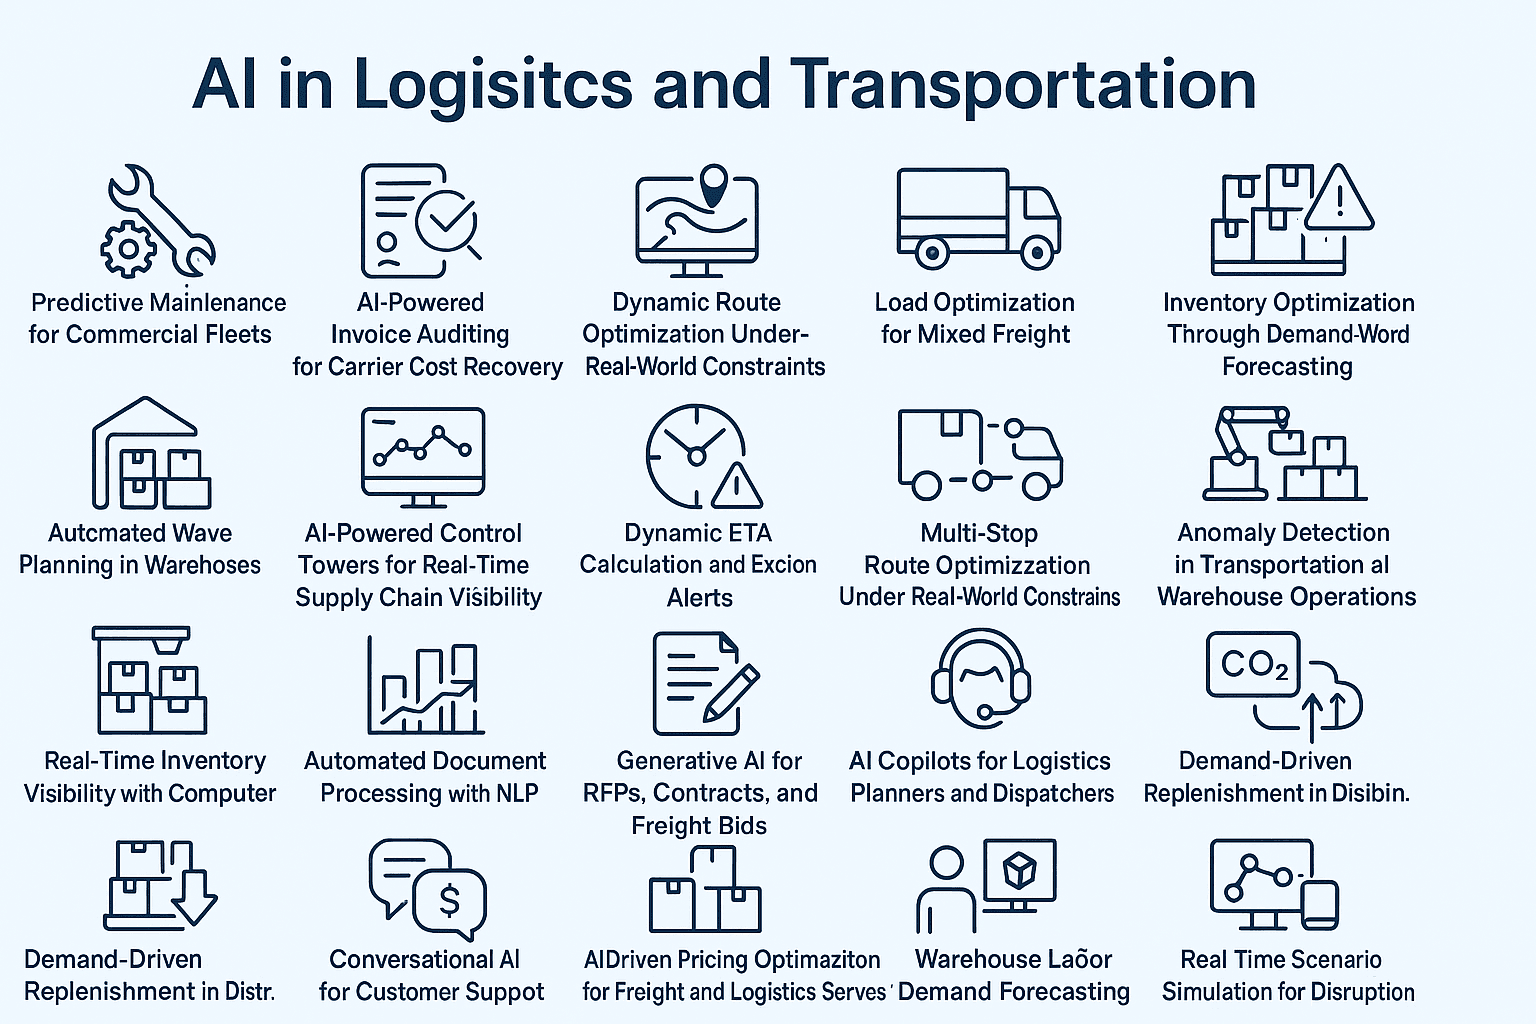
If you're exploring where AI fits in your operation, don’t start with the tech. Start with the problem.
Sphere works with logistics teams to identify gaps, design practical solutions, and implement them without the usual delays, detours, or fluff. Whether it's a one-off use case or a longer roadmap, we’ll help you figure out what’s worth doing—and do it right.
Let’s talk
about what’s next for your team.